Check Inbox Backlog and troubleshooting in SCCM 2012
A number of Stored
Procedures can be used to find more details about the backlog along with
monitoring of Transmission Queue.
The most useful one is the stored procedure called “spDiagDRS”. Run “EXEC spDiagDRS”
to get the below results (shown in the pic).
The stored procedure
“spDiagDRS” will fetch details about queued messages. Have a look at the
columns named “OutgoingMessagesInQueue” and “IncomingMessagesInQueue”.
In ideal scenario, there
should NOT be any queued messages and the values of those columns should be
ZERO.

In my scenario, “OutgoingMessagesInQueue” is
257 that means some error in the send and we have a backlog.
The stored procedure
“spDiagDRS” will also tell us about Status and LastSyncTime of each Replication
Group. In my example, the SiteSending is CAS and SiteReceiving is PR1.


Apart from spDiagDRS, there are some very useful
stored procedures that we can use at the time of backlog troubleshooting. See,
the list of Stored Procedures below. To filter the stored procedures type
spDiag in the filter settings

you can check out
the following examples of these along with parameters for in-depth troubleshooting.
EXEC
spDiagMessagesInQueue
EXEC
spDiagGetReplicationGroupStats ‘Configuration Data’, ‘PR1′
EXEC
spDiagGetProcedureStats ’100′
EXEC spDiagGetQueryStats
’10′
EXEC
spDiagGetRunningQueries ’10′
EXEC spDiagStartTrace
EXEC spDiagStopTrace
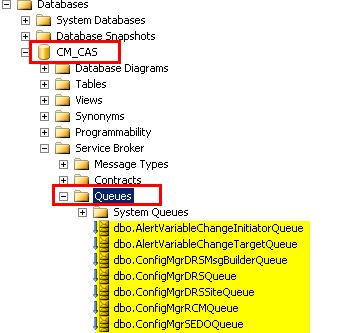
Transmission Queue is another option that we should look at, incase
of a backlog (or the out going messages are stuck). All the other queues
(ConfigMgrDRSSiteQueue, ConfigMgrRCMQueue, ConfigMgrDRSMsgBuilderQueue,
ConfigMgrDRSQueue etc. ) shown in the following pic are application related
queues.
To check Transmission
Queue, you need to run the below SQL query. With the below query, we can
check Transmission for a particular primary site (in the below query – CAS
server site code = CAS. Primary site code is PR1).
SELECT TOP 1000 *, casted_message_body =
CASE message_type_name WHEN ‘X’
THEN CAST(message_body AS NVARCHAR(MAX))
ELSE message_body
END
CASE message_type_name WHEN ‘X’
THEN CAST(message_body AS NVARCHAR(MAX))
ELSE message_body
END
FROM [CM_CAS].[sys].[transmission_queue] where to_service_name =
‘ConfigMgrDRS_SitePR1′
In the below figure, you
can see the records waiting for transmit. Have a look at the
“transmission_status” column, this will provide more details about any
transmission errors. This will be very helpful for further troubleshooting.


vLogs view is the DRS
(Data Replication Service) log file. This will provide us more details about DRS process and backlog.
Run the following SQL
query – “Select top 1000 * from vLogs order by LogTime desc” to get more
details about these logs.
RCM_ReplicationLinkStatus table can also provide us more details about
the link status of between the sites.
Run the SQL Query – “select
* from RCM_ReplicationLinkStatus” . Look at the StatusName column for more
details like Failed, Degraded etc.

TRACE stored procedure –
For In-depth analysis of backlog .
This can be performed by using following stored procedures.
Caution – this will create lot of overhead on SQL server also use lot of disk
space because of the creation ConfigMgrDBTrace.trc file.
EXEC spDiagStartTrace
EXEC spDiagStopTrace
You can start the trace
process with “EXEC spDiagStartTrace”. This process will create .trc
(trace file) – in the SQL installed location “C:\Program Files\Microsoft SQL
Server\MSSQL10.MSSQLSERVER\MSSQL\DATA\ConfigMgrDBTrace.trc”. Also, this process
will start tracing each and every event of the SQL server. To stop trace use
“EXEC spDiagStopTrace”. Ensure that you STOP the trace ASAP otherwise it may
create some adverse impact on the server.
We need to use SQL Server
Profiler to open the .trc file. You will get depth details about each event
performed by SQL server during the time of TRACE. like Duration, EventClass,
StartTime etc.

This comment has been removed by the author.
ReplyDeleterohit_bhatnagar_writer comment removed? why?
ReplyDelete